Overfitting is one of the fundamental issues that should be a mandatory part of any practical machine learning course. Without understanding it, one can do a great deal of harm. So what is it? Simply put, overfitting means being too confident in predictions that worked in the training data.
Overfitting happens when a machine learning model learns the training data too well, including noise and irrelevant patterns, making it perform poorly on new, unseen data. It’s like memorizing answers instead of understanding concepts. This leads to high accuracy on training data but poor generalization.
How to avoid it?
Cross-validation
A simple solution is splitting your data into training and testing data but splitting it means we have less train data so what is the better way to split it?
One solution is called leave-one-out cross-validation and it is one of the simplest ways of doing cross validation
Split the data into n different sets, and train the model n times, each time with a different combination of n - 1 sets, with the remaining set being used as a test set.
For example, if you have three data points (1, 2, and 3), you’ll train the model three times: - Train on {1, 2} and test on {3} - Train on {1, 3} and test on {2} - Train on {2, 3} and test on {1}
And check which model is the most accurate. This way you will get n estimates on how your selected model performs when using unseen data.
Example
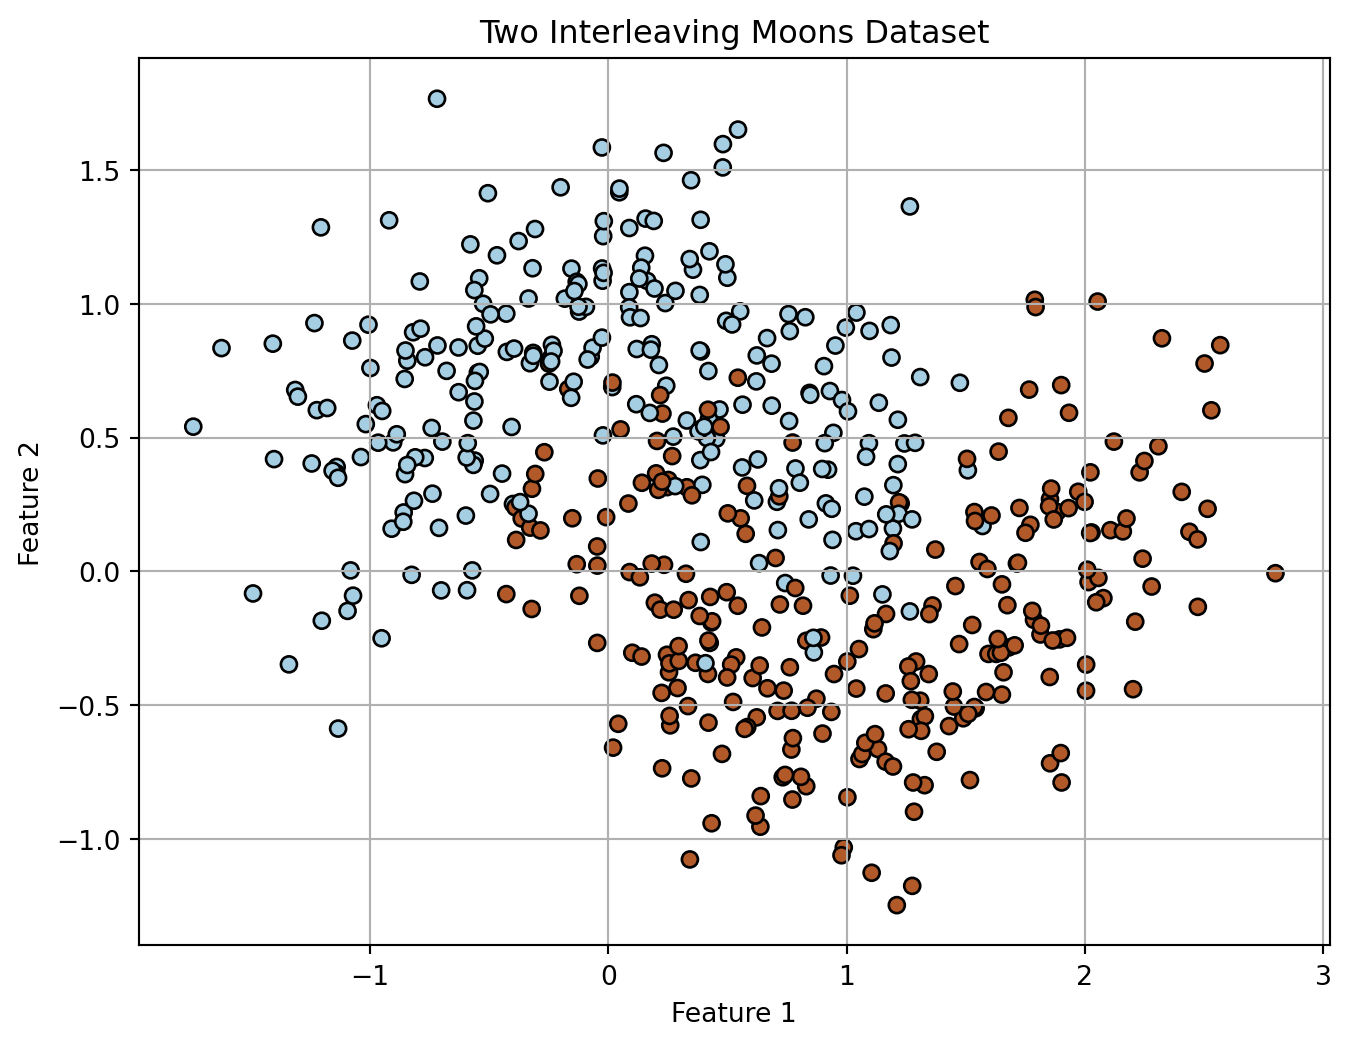
Let’s create a dataset with make moons, a function that creates data, in this case 500 data poits, wiht a noise of 0.3 to make it more random. random_state is a parameter for reproducibility that is used in lots of these functions that integrate random numbers
from sklearn.neighbors import KNeighborsClassifierfrom sklearn.datasets import make_moonsfrom sklearn.model_selection import train_test_splitimport numpy as npimport matplotlib.pyplot as plt# do not edit this# create fake datax, y = make_moons( n_samples=500, # the number of points random_state=42, # state for reproducibility noise=0.3# to make it a scatter plot insetad of just two crescends trully separated)plt.figure(figsize=(8, 6))plt.scatter(x[:, 0], x[:, 1], c=y, cmap=plt.cm.Paired, edgecolors="k")plt.xlabel("Feature 1")plt.ylabel("Feature 2")plt.title("Two Interleaving Moons Dataset")plt.grid(True)plt.show()
Now we can use this data to split it into train and test datasets. Then we can create a k-nearest neighbour model and test it with the train data and with the test data to check the differences
## split the x,y sets into test and train of 33% as testx_train, x_test, y_train, y_test = train_test_split(x, y, test_size=0.33, random_state=42)def evaluate(k): knn = KNeighborsClassifier(n_neighbors=k) #create k-nearest neighbours model knn.fit(x_train, y_train) train_acc = knn.score(x_train, y_train) #get the score with train data when k=1 this will be 1 test_acc = knn.score(x_test, y_test) #get the score with test dataprint(f"K = {k}:")print(f"Training accuracy: {train_acc:.4f}")print(f"Testing accuracy: {test_acc:.4f}")evaluate(1)evaluate(250)evaluate(42)evaluate(100)
K = 1:
Training accuracy: 1.0000
Testing accuracy: 0.8606
K = 250:
Training accuracy: 0.7672
Testing accuracy: 0.8121
K = 42:
Training accuracy: 0.9254
Testing accuracy: 0.9091
K = 100:
Training accuracy: 0.8806
Testing accuracy: 0.8909
Conclusions from this example
When k=1, train accuracy will be 1 because closest would be itself (That’s definitly overfitting)
A reasonable baseline to beat in this code would be 50% of the test data to give accurate results since the goal is to classify data in two classes. If it consistently gives a score of more than 50%, it means the model is learning something rather than just guessing the result.
Out of the values tested, k=42 preformed the best on the test data so we can say it was the best because it gave the highest test accuracy (0.9091)
To have a higher test set accuracy than training set accuracy. For example if you are doing a classification task like here, if your data sets have class imbalance it can easily lead to such a scenario, or if your test set points in this example here would have been picked far away from the decision boundary then they would have been easier to classify correctly than those near the border.
Regularization (TODO)
Ridge Regression (L2 Regularization)
A regularized version of Multiple Linear Regression that prevents overfitting.
Adds a penalty term (L2 norm) to shrink coefficients toward zero but never makes them exactly zero.